Options Screener
Find mispriced volatility in seconds
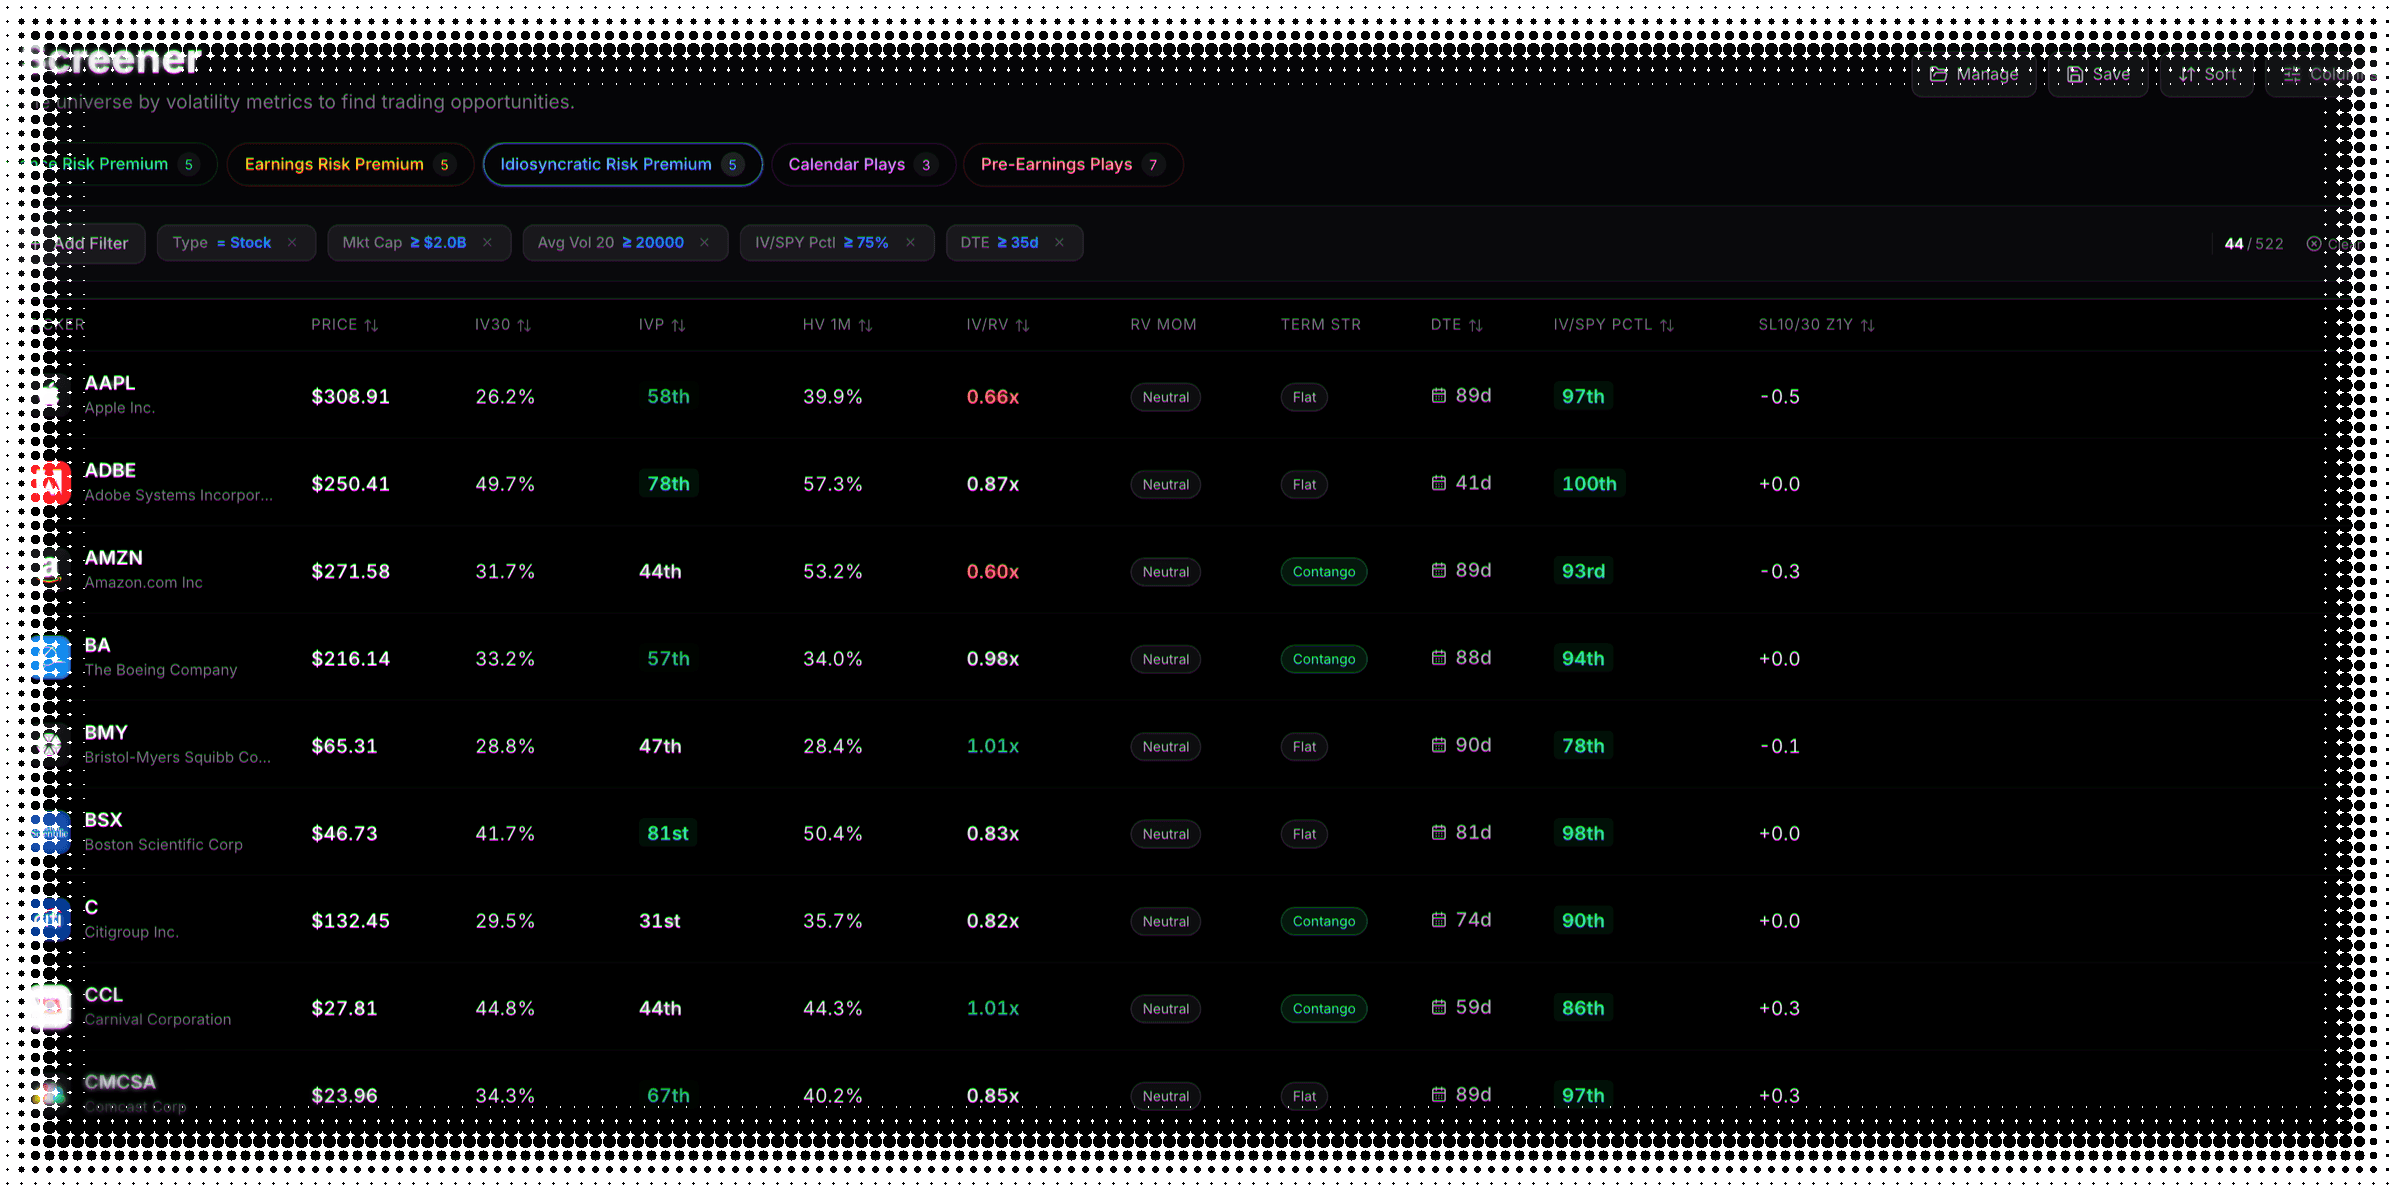
Filter 500+ stocks and ETFs across 207 volatility metrics — implied against realized, term structure, skew, earnings history — and surface the names where premium looks mispriced.
207 metrics · 500+ names · Updated daily
Convergence
Where the rest of the platform lands.
Five pre-built screens, each running a signal another page spends its whole length explaining.
Every preset filters on work the platform has already done. What comes out is a handful of names worth opening — not a verdict.
Nothing hidden
A preset is a starting point, not a black box.
Open any screen and its criteria are chips you can read, move, or throw away.
As it ships
Every threshold is a chip
Open a preset and its filters are right there, labelled and editable. Nothing about the screen is hidden from you.
As you want it
Loosen one, widen the list
Too few names? Move a dial and see the list grow. Save the result as your own screen.
The table
Two hundred and seven columns you can actually read.
Every metric on the volatility surface, and every header explains itself.
Make it yours
Then stop using ours.
Build a screen from any of the 206 filterable metrics and keep it on your account.
Sorting
Five criteria deep
Rank on one column, then break its ties with the next. Click a header or set the whole priority stack.
Saved screens
Your screens, kept
Save a filter set to your account under a name, and load it back whenever you want it.
Each screen runs a signal explained in full elsewhere: variance risk premium, term structure, volatility against the market, and earnings premium.
Options screener FAQ
What to know about screening volatility
A volatility screener built for options traders. Filter 500+ stocks and ETFs across 207 metrics — implied against realized volatility, term structure, skew, earnings history — to find names where premium looks mispriced. Results refresh as you adjust the filters; there is no Run button.
Stock screeners filter on price, fundamentals and technicals. This one screens the options surface: variance risk premium, implied volatility against a name’s own history, term-structure shape, skew, and earnings premium — the numbers that decide whether an option is rich or cheap. None of them appear on a conventional screener.
Five: Variance Risk Premium, Earnings Risk Premium, Idiosyncratic Risk Premium, Calendar Plays, and Pre-Earnings Plays. Each encodes a setup the rest of the platform explains in depth — Calendar Plays runs the same forward-factor signal as the Term Structure tab, Idiosyncratic Risk Premium the same volatility-versus-market comparison as Relative Value. Four of the five look for premium worth selling; Pre-Earnings Plays is the one that looks for premium worth buying.
Yes, and you can see exactly what it is looking for first. Opening a screen loads its filters as labelled chips — the metric, the comparison and the cut-off — and every one of them is editable. Loosen a threshold to widen the list, tighten it to narrow it, drop a criterion you disagree with, then save the result to your account as your own screen. Nothing about a preset is hidden from the person using it.
Yes. Filter on any of 206 metrics, searching the catalogue by name or description, with one-click ranges for common setups. Filters combine with AND — each one narrows what the last one left — and you can put one filter on each metric. Sort on up to five criteria at once, and choose up to 20 of the 207 columns to show.
The filter set and the column selection are stored against your account under a name you choose, and saving again under the same name updates it rather than creating a duplicate. One thing worth knowing: the sort order is not part of what gets saved, so you will want to reapply it when you load a screen back.
The table returns up to 500 rows. The counter above it shows how many tickers actually match your filters, so if it reads higher than 500 you are looking at the first 500 of a larger set rather than the whole thing. In practice that only happens on very loose screens — the point of a screener is to get the list under 500 by a wide margin.
Every one of the 207 columns carries a written description, shown when you hover its header and again in the filter picker when you search for it. Cell shading is a heat map showing where a value sits in its own range — and it is deliberately switched off for the handful of signals where a low number is the good direction, because colouring those green or red would tell you the opposite of the truth.
Click the ticker to open the full analysis — term structure, skew, earnings history and trade simulation — before you commit any capital. On the Calendar Plays screen that link is sharper still: it drops you onto the term-structure view with the forward-factor comparison already in front of you. On desktop you can also star a name straight into your watchlist without leaving the table.
Not today. There is no CSV export, no download, and no alerting when a name enters or leaves a screen. The screener is a research surface you come back to rather than a notification service, and saved screens are how you return to a question rather than being told about it.
Roughly five hundred of the most liquid US stocks, plus major ETFs — the same universe the rest of the platform analyses, so anything you find here has a full volatility history behind it. The exact count drifts as index membership changes, which is why the number is never stated precisely.
No — deliberately end-of-day. Every volatility metric in the table is computed once the market closes. The results refreshing as you drag a filter is the interface being quick, not the data being live. The edges this screener targets are structural, measured in days and weeks, so you are making a decision about the next month rather than the next minute.
Still have questions? Contact support
Stop scrolling option chains. Start screening volatility.
We're getting ready to launch. Join the list and you'll be first in the door.