Position Builder
Build it before you risk it
Thirty-eight multi-leg structures, priced off a real options chain, with every position Greek and a payoff curve that answers back as you move time and volatility — before a single dollar is committed.
38 structures · 5 Greeks · 10,000-path simulation
The library
Thirty-eight structures, already assembled
You pick the shape. The legs, directions and ratios come with it.
More legs is a different shape, not more work — strikes land on the chain, expiration near forty-five days.
The chain
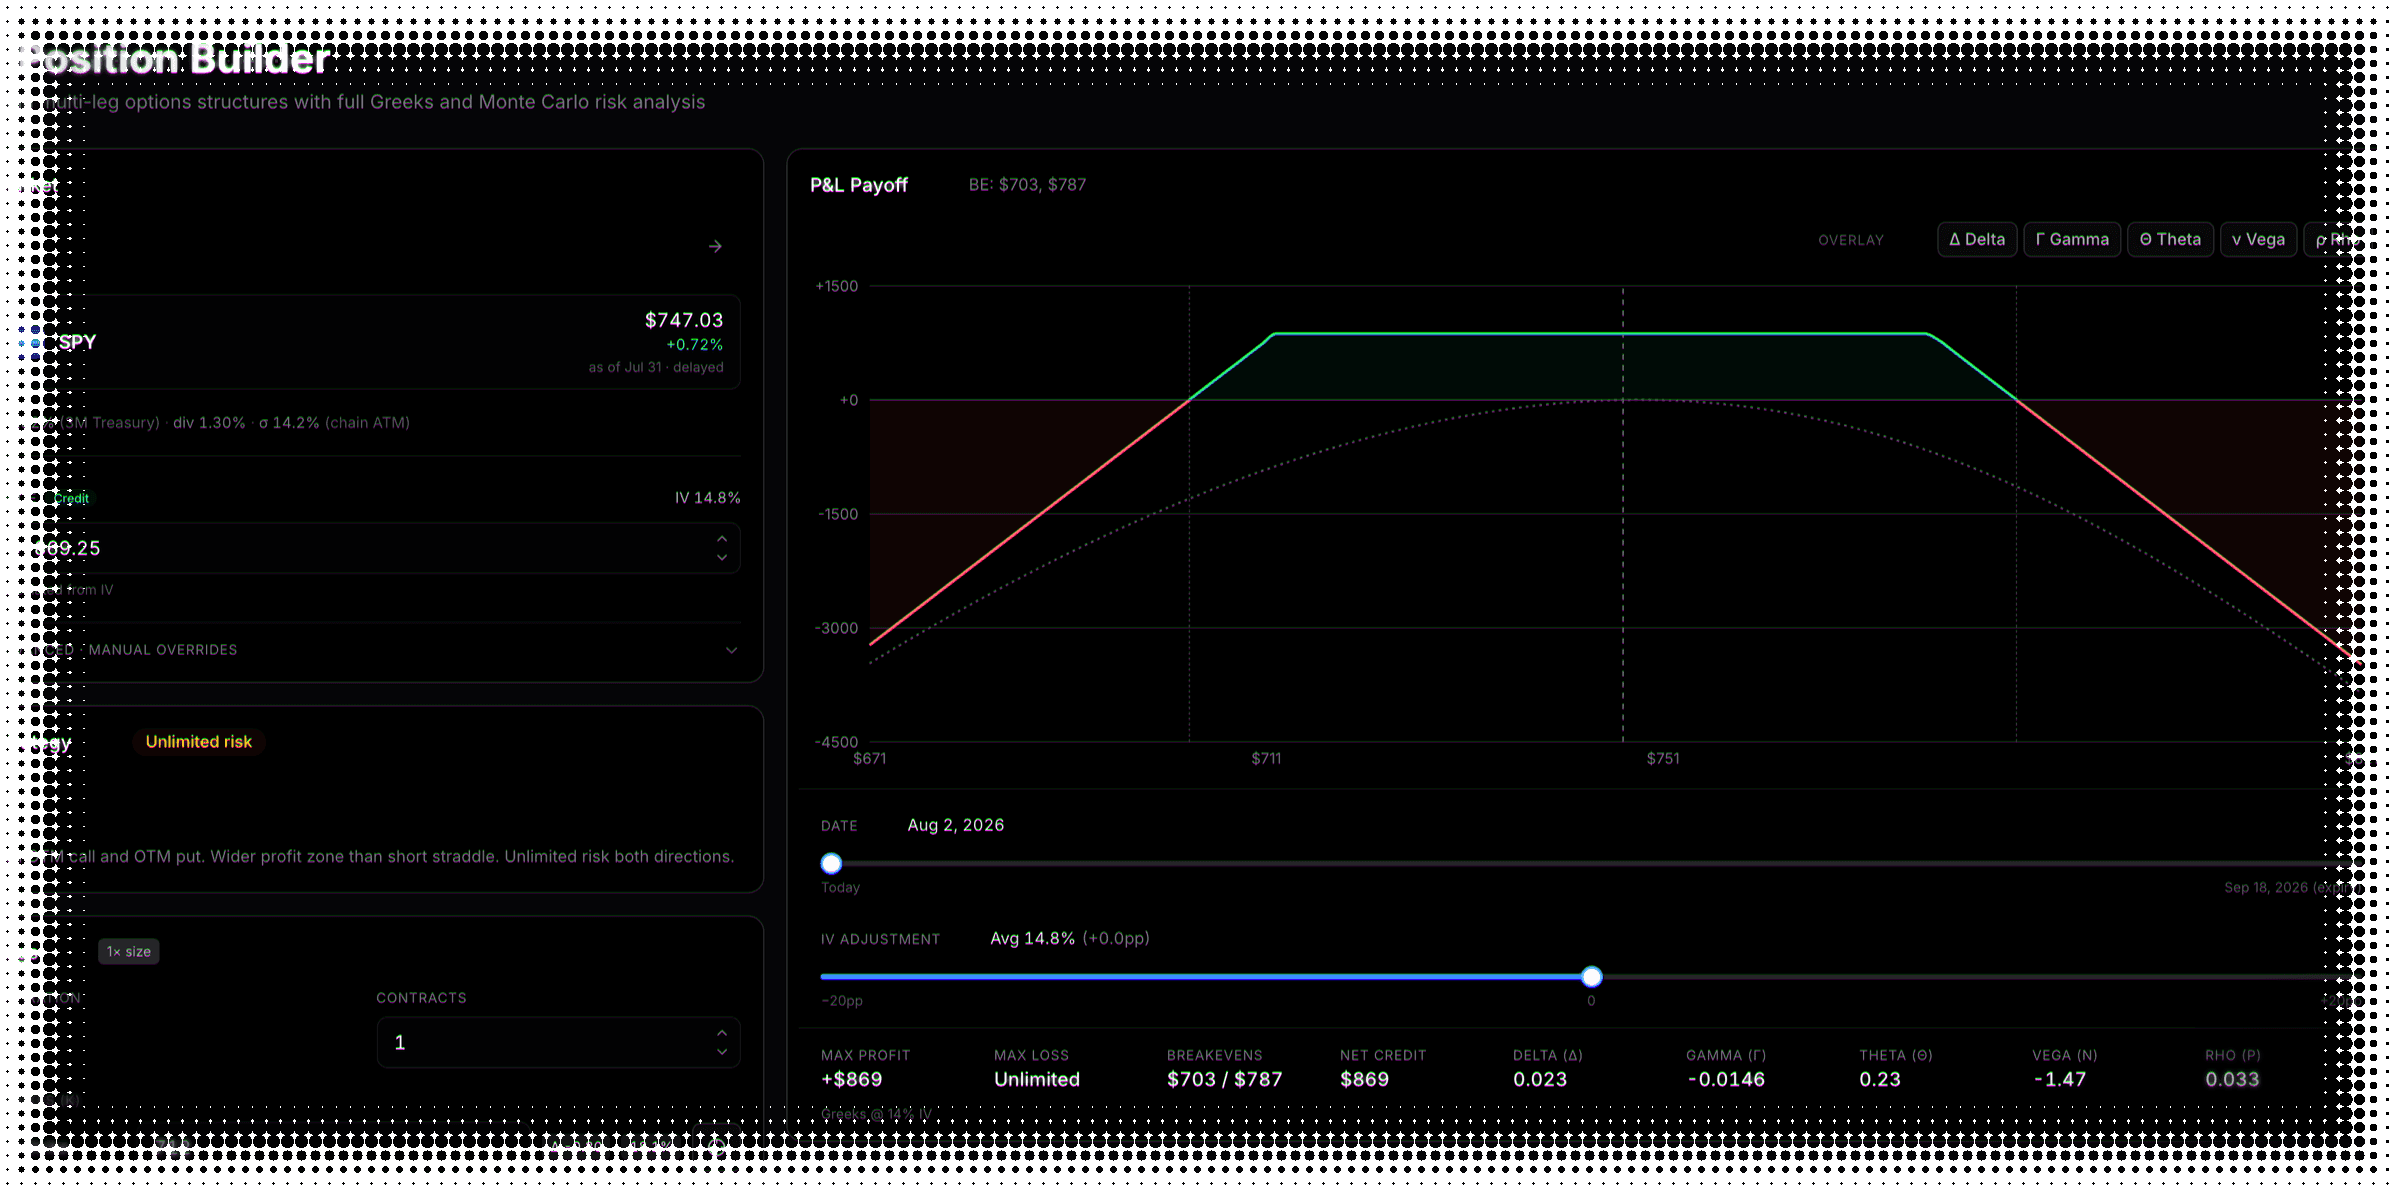
Worth this much now. Break even here.
Every leg priced on its own contract's implied volatility, off the latest end-of-day chain.
The kinked line is expiration, the lit curve today. The gap between them is time value, at every price.
Scenarios
Then move time and volatility
A payoff diagram shows where you end up, not the way there.
Time
Move the date forward
Watch the value curve collapse onto the payoff line — theta at every price, not quoted at one.
Volatility
Shift implied volatility
Push every leg up or down by twenty points — a vol crush seen before the event, not after.
Exposure
Overlay one Greek
Delta, gamma, theta, vega or rho across the whole price range — see where your exposure concentrates.
Risk
And stress-tested ten thousand times
One line becomes a distribution. The tail is what a single number hides.
Value at risk
Where the bad case starts
Ten thousand simulated outcomes, cut at the fifth and first percentile — the loss you size around.
Conditional value at risk
And how bad it gets past there
The average of everything beyond that cut. Two structures can share a cut and part company here.
It’s a model, not a prophecy — better for comparing two structures than predicting one trade. The same end-of-day chain drives the forward-factor calculator on the term structure view.
Position builder FAQ
What to know before you model a structure
A place to design a multi-leg options structure and see what it does before you commit to it — the payoff curve, the position Greeks, the breakevens, and a simulated distribution of outcomes. You pick a structure, it builds the legs off a real option chain, and you can then push time and volatility around to see how the position behaves.
Thirty-eight templates across ten categories — singles, verticals, straddles and strangles, butterflies, condors, calendars and diagonals, ratios and backspreads, ladders, Christmas trees, and synthetics — spanning one to four legs. You choose a structure rather than assembling legs one at a time, so the direction and the ratios of each template are already correct; switching from a bull call spread to a bear call spread is a single change.
Each template arrives with strikes snapped to the listed chain — by target delta where that makes sense, by distance from spot where it does not — and an expiration picked as the listed one closest to forty-five days out. Every strike and expiration is then yours to change, and you can arm a leg and click a strike in the chain to move it.
One slider moves the valuation date from today up to the nearest expiration; the other shifts every leg’s implied volatility together, up or down by as much as twenty percentage points. The payoff curve, the breakevens and all five position Greeks recalculate as you move them. It is immediate because the pricing math runs in your browser rather than on a server.
The chart carries one Greek at a time. You pick delta, gamma, theta, vega or rho and it is drawn across the whole price range on its own axis; choosing another replaces it, and you can clear it entirely. That is separate from the metrics strip, which shows all five position Greeks together and updates with the sliders — so the single curve is about where an exposure concentrates, and the strip is about what it adds up to right now.
From that leg’s own contract on the chain — its strike, its side, its expiration. A skewed put is priced on its own skew rather than on one average number for the whole position, and a calendar pulls a second chain so the far leg uses its own tenor. Each leg shows a small label saying which it used. If you type in a market price or edit the volatility field by hand, the whole position switches to that single number instead, and the interface says so.
No — it is the most recent end-of-day chain, and the snapshot date is shown on the card. Because end-of-day option data publishes the following session, the chain can trail the stock quote by a day while the market is open; the quote itself is labelled delayed. A live feed is a planned upgrade rather than a limit of the underlying data plan.
Black-Scholes-Merton with a continuous dividend yield, using the three-month Treasury for the risk-free rate. Both of those are visible and you can override them. It is a European-style model, so it does not account for early exercise, assignment, or discrete ex-dividend dates, and it prices at theoretical mid with no commissions, fees or slippage — a structure will cost slightly more to put on in the real world than it does here.
That the risk on that side is genuinely open-ended — a naked short call, for instance, has no worst case. Rather than printing the worst number inside the plotted price range and letting it look like a bound, it says Unlimited. Which structures those are is derived from the legs themselves and has been checked against all thirty-eight templates.
It turns one payoff line into a distribution. Ten thousand price paths are simulated to the nearest expiration under geometric Brownian motion, the position is valued at each of them, and you get the probability of profit, the mean and median outcome, how wide the spread is, how skewed and fat-tailed it looks, and the worst cases. It assumes constant volatility, the position held to expiration with no adjustments, and no trading costs — so it is better for comparing the shape of two structures’ risk than for predicting what any one trade will do. Runs are reproducible: the same inputs give the same distribution every time.
Value at risk is a cut: at 95%, the loss that only the worst one run in twenty exceeds. Conditional value at risk is the average of everything past that cut — so it answers the different question of how bad it is when it is bad. Both are shown at 95% and 99%, and if the tail was profitable they read None rather than dressing a gain up as a loss. Two structures with the same value at risk can look very different once you read the conditional figure.
Neither. There is no broker connection, no order ticket, no margin or buying-power calculation, and nothing is ever routed or transmitted anywhere. Clicking a strike in the chain moves a leg inside the model, and that is the whole extent of it. Positions are not saved or exported either. This is a place to think a structure through — then go and place it wherever you actually trade.
Still have questions? Contact support
Model the trade before the market does it for you.
We're getting ready to launch. Join the list and you'll be first in the door.