Simulate
How big should the trade be?
Ten thousand simulated paths of a delta-hedged short strangle, turned into the question every other tool skips — not whether the trade is good, but how many contracts you can survive being wrong about.
10,000 paths · Delta hedged · VaR, CVaR & bankruptcy risk
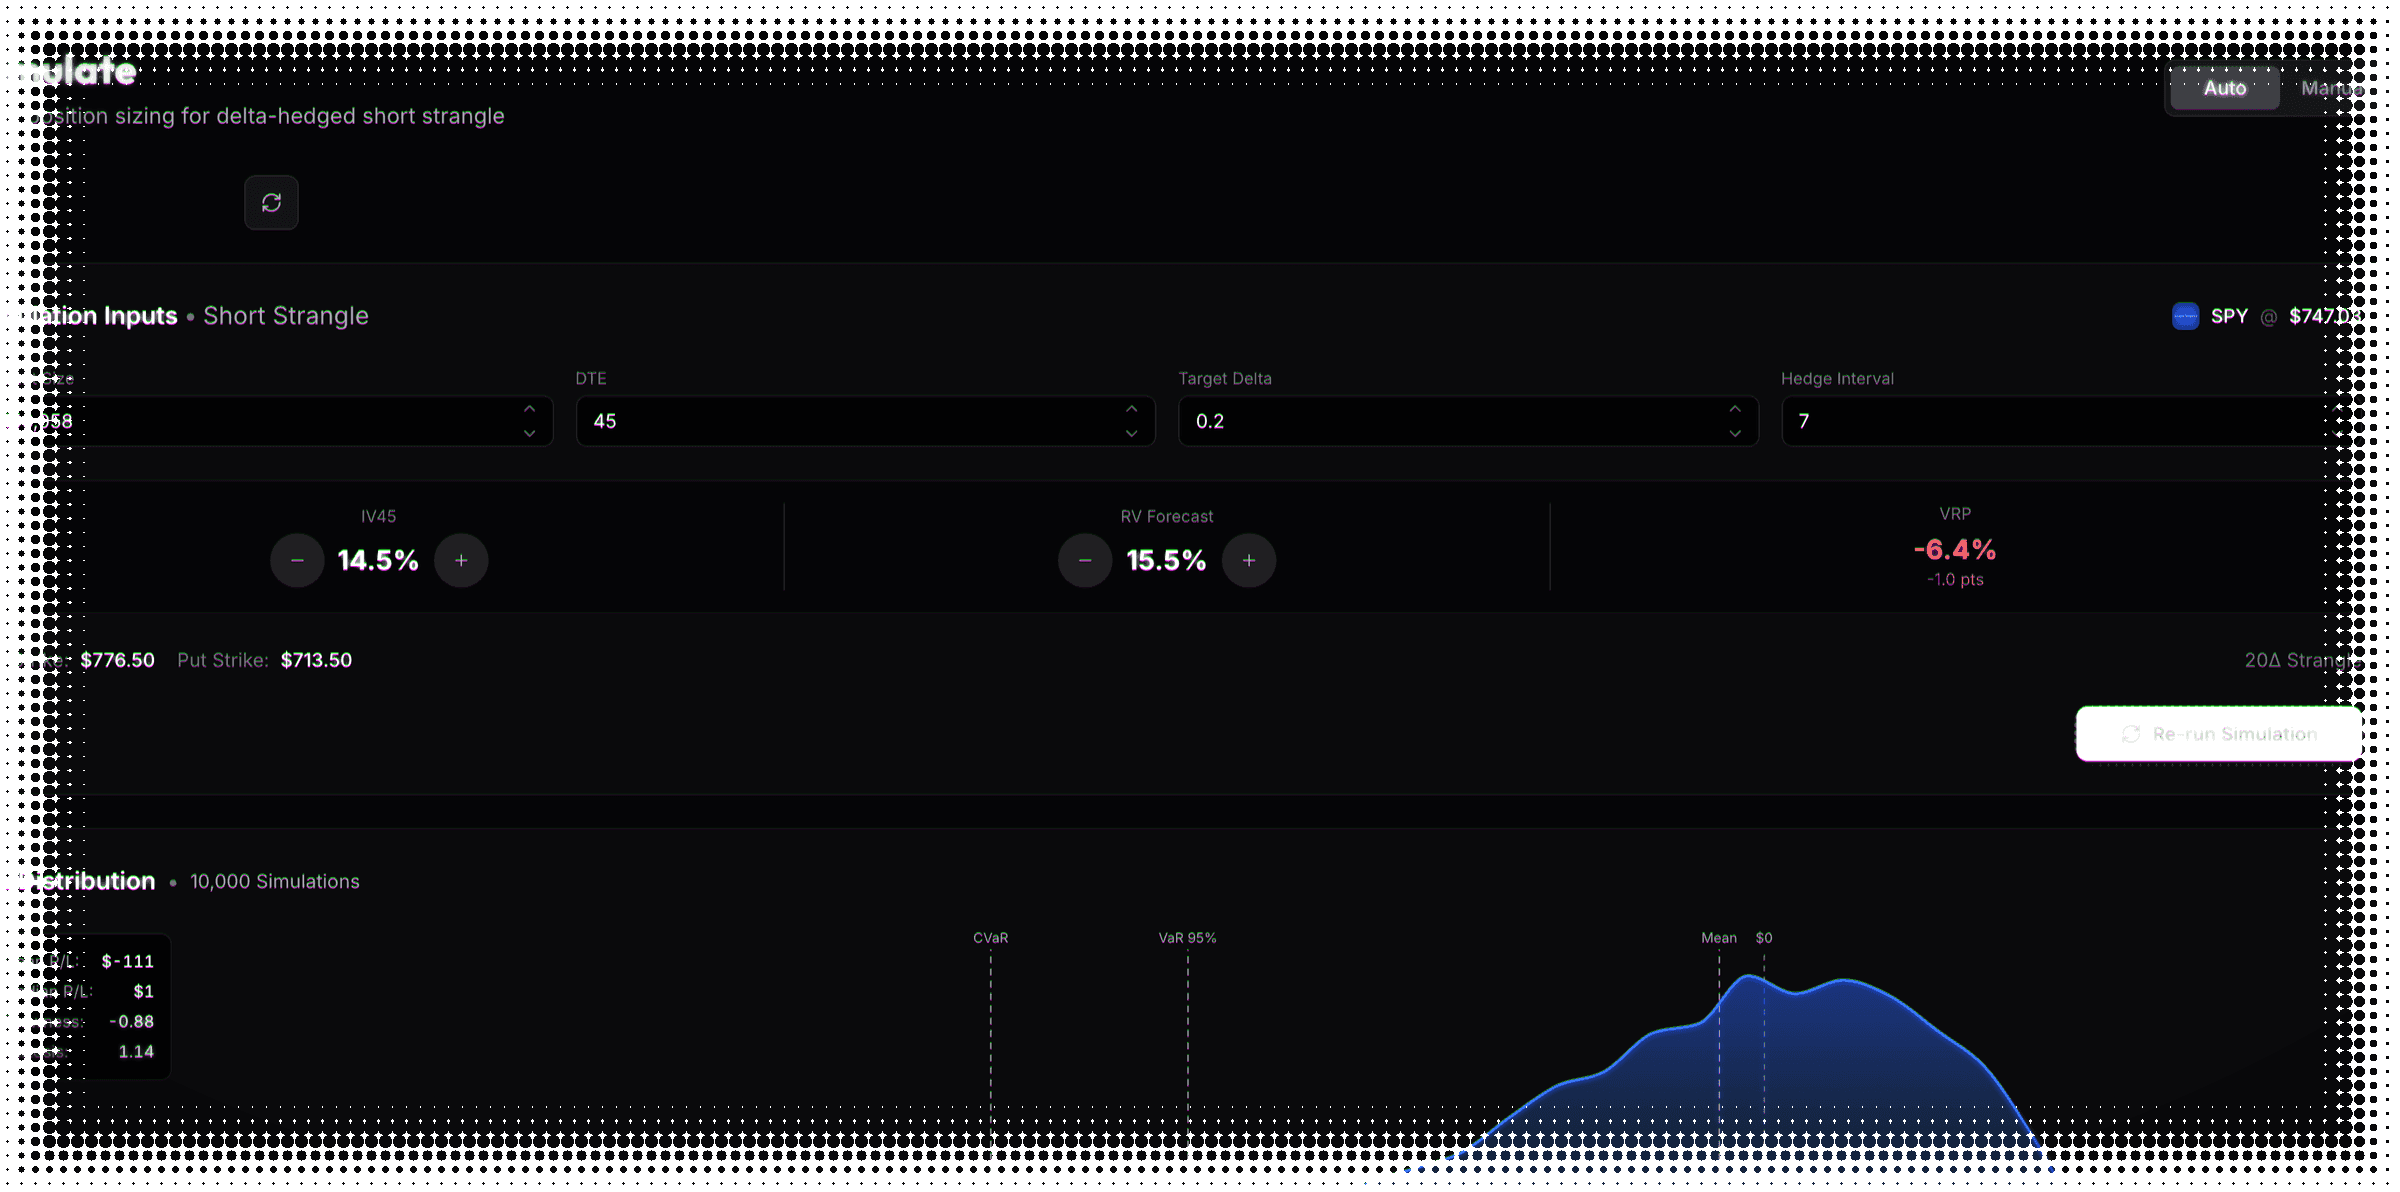
The trade
A strangle, hedged the way you'd actually hedge it
Most simulations price the position once and jump to expiry. This one walks every day.
Every rebalance pays the stock's bid-ask spread — the further it moved, the more it costs.
The inputs
Only as good as the two numbers underneath it
One is what you were paid. The other is what the stock is forecast to do.
Realized
A forecast, not a backward glance
An exponentially weighted year of returns — last week counts far more than last autumn.
The gap
Paid at one vol, moving at another
You’re paid the volatility you sold; the paths move on the forecast. That distance is the premium.
No trade
It tells you to stay flat
When the simulated result isn’t positive, the ladder returns Not Applicable, not a contract count.
The outcome
One path is a guess. Ten thousand is a distribution.
Each one collects the premium, pays its hedges and settles at intrinsic. What they paid is the distribution.
Sizing
Five sizes, and what each one does to you
Bigger looks better on return, right up until the bankruptcy column starts to move.
Smaller
A size you can survive
Twenty-four periods of compounding, resampled ten thousand times — most accounts come through intact.
Larger
And one you might not
Survivors finish higher — which is why bigger looks better — but more never finish at all.
There is no recommended row — that trade-off is yours. And it only models the strangle: for other shapes, the position builder carries thirty-eight structures and a simulation of their own.
Monte Carlo FAQ
What to know before you size a premium-selling trade
A delta-hedged short strangle, ten thousand times. Each path collects the premium on both legs, re-hedges the position’s delta on your chosen interval, pays the stock’s bid-ask spread on every one of those hedges, and settles the options at intrinsic value on expiry. The result isn’t one number — it’s the full distribution of what that trade could have paid.
Because it’s the cleanest expression of the premium-selling trade, and because a focused model beats a general one. Delta hedging on a schedule is a mechanical rule a simulation can represent honestly, so the output means something. If you want a different structure — a spread, a condor, a jade lizard — that’s the position builder’s job, and it has a simulation of its own.
Days to expiry, the target delta that picks your strikes, how often the position re-hedges, and your account size — plus the implied and realized volatility themselves if you disagree with what was fetched. Forty-five days, twenty-delta strikes and a weekly re-hedge are starting points, not fixed properties of the model. What you can’t change is the structure: it is always a one-contract short strangle, and every result is quoted per contract.
Yes — there’s a manual mode where you type the stock price, both strikes, the credit you’d collect, your own realized-volatility forecast and the bid-ask spread you expect to pay. One thing to know: the credit is used to back out an implied volatility, and the engine then re-prices the strangle from that volatility. So the simulated credit lands very close to what you entered rather than exactly on it.
Implied volatility is fitted from the end-of-day options chain. Rather than trusting a printed number, each strike’s volatility is backed out of its bid-ask mid, stale and implausible quotes are dropped, and a curve is fitted across delta and read at both of your strikes — then interpolated between the two nearest expirations to your exact number of days. Realized volatility is an exponentially weighted forecast from the trailing year of returns. It’s end-of-day data throughout, so the chain can trail an open market by a session.
Because those two numbers answer different questions. Implied volatility is the price you were paid — it sets the premium you collect and the deltas you hedge against. The forecast is your best estimate of how much the stock will actually move, and that’s what should drive the simulated prices. Selling premium is a bet on the distance between them, so a simulation that used implied for both would quietly assume you were right by construction.
The stock’s bid-ask spread, charged on every share traded at every rebalance — and the further the stock has moved since the last hedge, the more shares change hands and the more it costs. That’s usually where a theoretically profitable strangle turns into an unprofitable one, so it is charged rather than assumed away. It is also the only cost modelled: no commissions, no slippage on the options themselves, no financing.
It doesn’t decide — it shows you the trade-off. Five sizes, from a sixteenth of the risk unit up to the full one, all five in one table. Each is compounded through twenty-four periods across ten thousand portfolio paths, drawing a fresh outcome from the simulated distribution each period. For every rung you see the contracts it implies, the Sharpe ratio it produced, and the share of paths that went bankrupt. There is no recommended row, deliberately.
It’s the name of the fractions, not a derivation. Each rung sizes as that fraction of your account divided by the risk unit — the 95% value at risk of a single contract — so a half-Kelly row risks half as much of the account as the full row. It is not computed from your edge or your win rate. What is genuinely simulated, and what the table is actually for, is the Sharpe ratio and the bankruptcy rate beside each rung.
It says so. If the simulated average outcome — after the hedging costs — isn’t positive, the sizing table returns Not Applicable rather than a contract count. Note the test is the simulation’s own result, not simply whether implied volatility sits above the forecast: a trade that hedges expensively can clear that bar and still fail this one. Staying flat is a position, and a sizing tool that can’t recommend it isn’t telling you the truth.
Close, but not identical. The random draws aren’t seeded, so re-running the same inputs reshuffles ten thousand fresh paths and the numbers move a little — more so on the tail statistics like value at risk than on the probability of profit. That’s a property of sampling rather than a fault: if a decision flips between two runs of the same trade, the honest reading is that the difference was never big enough to act on.
It’s a model, and it’s honest about being one. Prices follow a lognormal random walk with volatility held constant for the life of the trade — which means no overnight gaps, no crashes, no volatility spikes, and no dividends or early assignment. Real short strangles fail in exactly those moments. Nothing appears on screen until you actually run it, and there is no saving, exporting or order routing anywhere in it. Use it to compare how two sizes behave, not to predict what any single trade will do.
Still have questions? Contact support
Size it before the market sizes you.
We're getting ready to launch. Join the list and you'll be first in the door.