Relative Value
Expensive compared to what?
A stock's implied volatility means little on its own. Measured against SPY, you can see whether you're being paid for the stock's own risk or just for market beta.
SPY benchmark · Implied and realized · Correlation and beta
The benchmark
Expensive compared to what?
One number can't tell you whether volatility is rich. A relationship can.
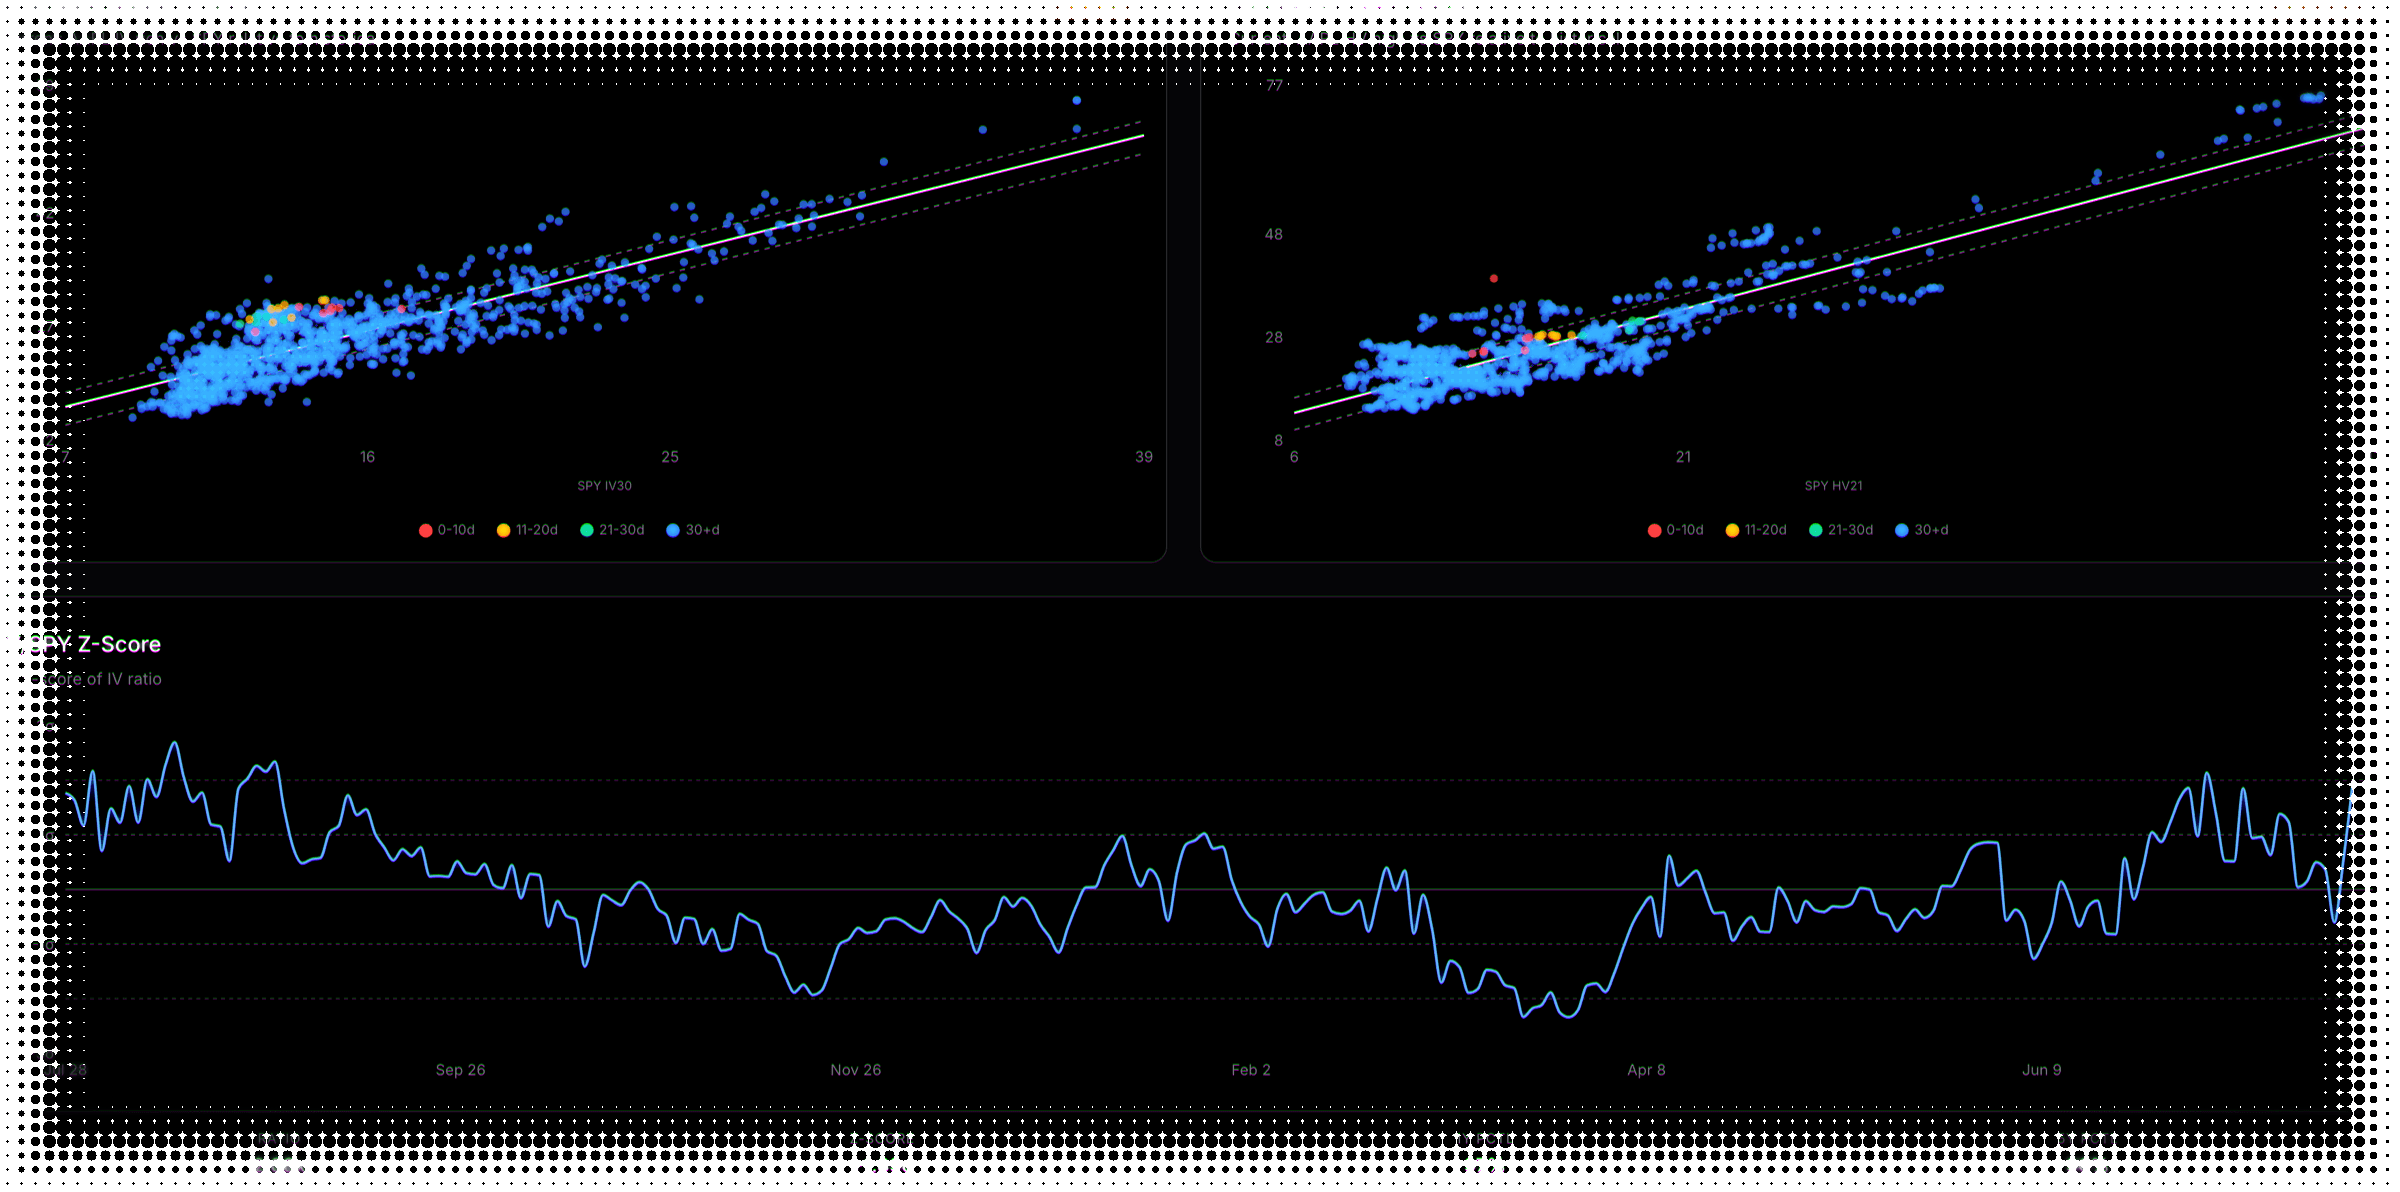
Each dot is one day. The solid line is the relationship those days imply; the dashed bands mark how far this stock normally strays from it.
Two questions
Tracking the market isn't the same as matching it.
Correlation answers one of these and is silent on the other, which is how positions get mis-sized.
Correlation
Do they move together?
How tightly the stock tracks the market, at thirty, sixty or ninety days — one window at a time.
Beta
And by how much?
The same tight relationship, steeper. A stock can track the market almost perfectly and still move twice as far.
Both bases
Is the richness priced, or delivered?
The same comparison run on what the options charge and on what the stock has actually done.
Off its line on the implied side and on it on the realized side means the options are charging for movement the stock hasn't been delivering.
The one-year percentile of that IV-to-SPY ratio is what drives the Idiosyncratic Risk Premium screen in the options screener, which also requires a name to be well clear of its next earnings report before it qualifies. For the other half of the context — where the stock itself has been going rather than what its options cost — see price momentum.
Relative value FAQ
What to know about measuring a stock against the market
A stock’s implied volatility on its own tells you very little. Thirty percent is cheap for one name and expensive for another, and both readings move when the whole market moves. Relative value measures the stock against SPY instead, so you can separate the premium that belongs to the stock from the part that is just the market being volatile underneath it.
Every trading day in the window is one dot: the market’s volatility on one axis, the stock’s on the other. Up to 1,260 daily points go in, though a recently listed name will have fewer. Recent days are drawn brighter than older ones, because several years of dots is otherwise an unreadable cloud.
The solid line is a least-squares fit through the dots — the relationship those days imply between the two. The dashed bands sit at the 25th and 75th percentile of how far the dots fall from that line, so they describe how much this particular stock normally strays from its own relationship with the market. They run parallel to the fit because they are offsets from it rather than separate fits.
That the stock’s volatility is unusual relative to the market’s — not unusual on its own, which is a different and much weaker statement. Above the upper band means it is carrying more volatility than its own history with the market would predict. It is a description of where things stand, not a forecast, and not a trade on its own.
The stock’s thirty-day implied volatility divided by SPY’s. It compresses the whole relationship into one number: above one, the stock is carrying more implied volatility than the market. The tab tracks it against the stock’s own history so you can see whether today’s reading is ordinary or stretched for this particular name.
They are two different measurements and it is worth keeping them apart. The ratio percentile ranks today’s IV-to-SPY ratio against that same ratio’s own past year — a percentile of one number over time. The scatter bands rank how far dots fall from a fitted line — a percentile of residuals around a relationship. A stock can sit high on one and unremarkably on the other. The options screener’s Idiosyncratic Risk Premium screen filters on the first of the two.
Correlation measures direction: do the stock and SPY tend to move the same way? Beta measures magnitude: how far does the stock move for a one percent move in SPY, measured over a rolling sixty trading days? A stock can track the market almost perfectly and still be twice as volatile, so correlation alone would miss the risk entirely. The tab reports both, and reading either one without the other is how people end up mis-sizing a position.
Thirty, sixty or ninety days are available, one at a time, and sixty is the default. Shorter windows react faster to a regime change and are noisier for it; longer windows are steadier but slower to notice that a relationship has broken. If a stock has decoupled from the market recently, the thirty-day window will show it first.
Because they answer different halves of the question. The implied scatter compares what the options market is charging for the stock against what it charges for SPY. The realized scatter compares what the stock has actually done — measured with Yang-Zhang, which accounts for overnight gaps — against what the market has actually done. Reading them together tells you whether a rich reading lives in the priced volatility, in the delivered volatility, or in both.
No. SPY is the benchmark throughout, and it is fixed — there is no picker for sectors, industry peers or another index. That is a real limitation worth knowing before you rely on it: for a name whose natural comparison is its own sector rather than the broad market, these readings describe the relationship with the market and not with the peers you may care about.
No. Everything here is descriptive — where a stock sits relative to the market and relative to its own history with the market. A rich reading can stay rich, and a stock can be expensive against SPY for a perfectly good reason that has not shown up in the price yet. These measurements narrow the question; they do not answer it.
No — deliberately end-of-day. Relationships between a stock and the market are measured over months and years, so the questions this view answers do not change tick by tick. Coverage is roughly five hundred of the most liquid US stocks plus major ETFs, and unlike some views here the ETFs work too — they have a relationship with the market like anything else.
Still have questions? Contact support
Find out whose risk you're being paid for.
We're getting ready to launch. Join the list and you'll be first in the door.