Price Momentum
One of the best-documented effects in finance
Momentum is among the most studied effects in equity markets. Here it's measured the way the original papers define it — four independent readings, no blended score, and no claim about what happens next.
4 studies · S&P 500 & major ETFs · No blended score
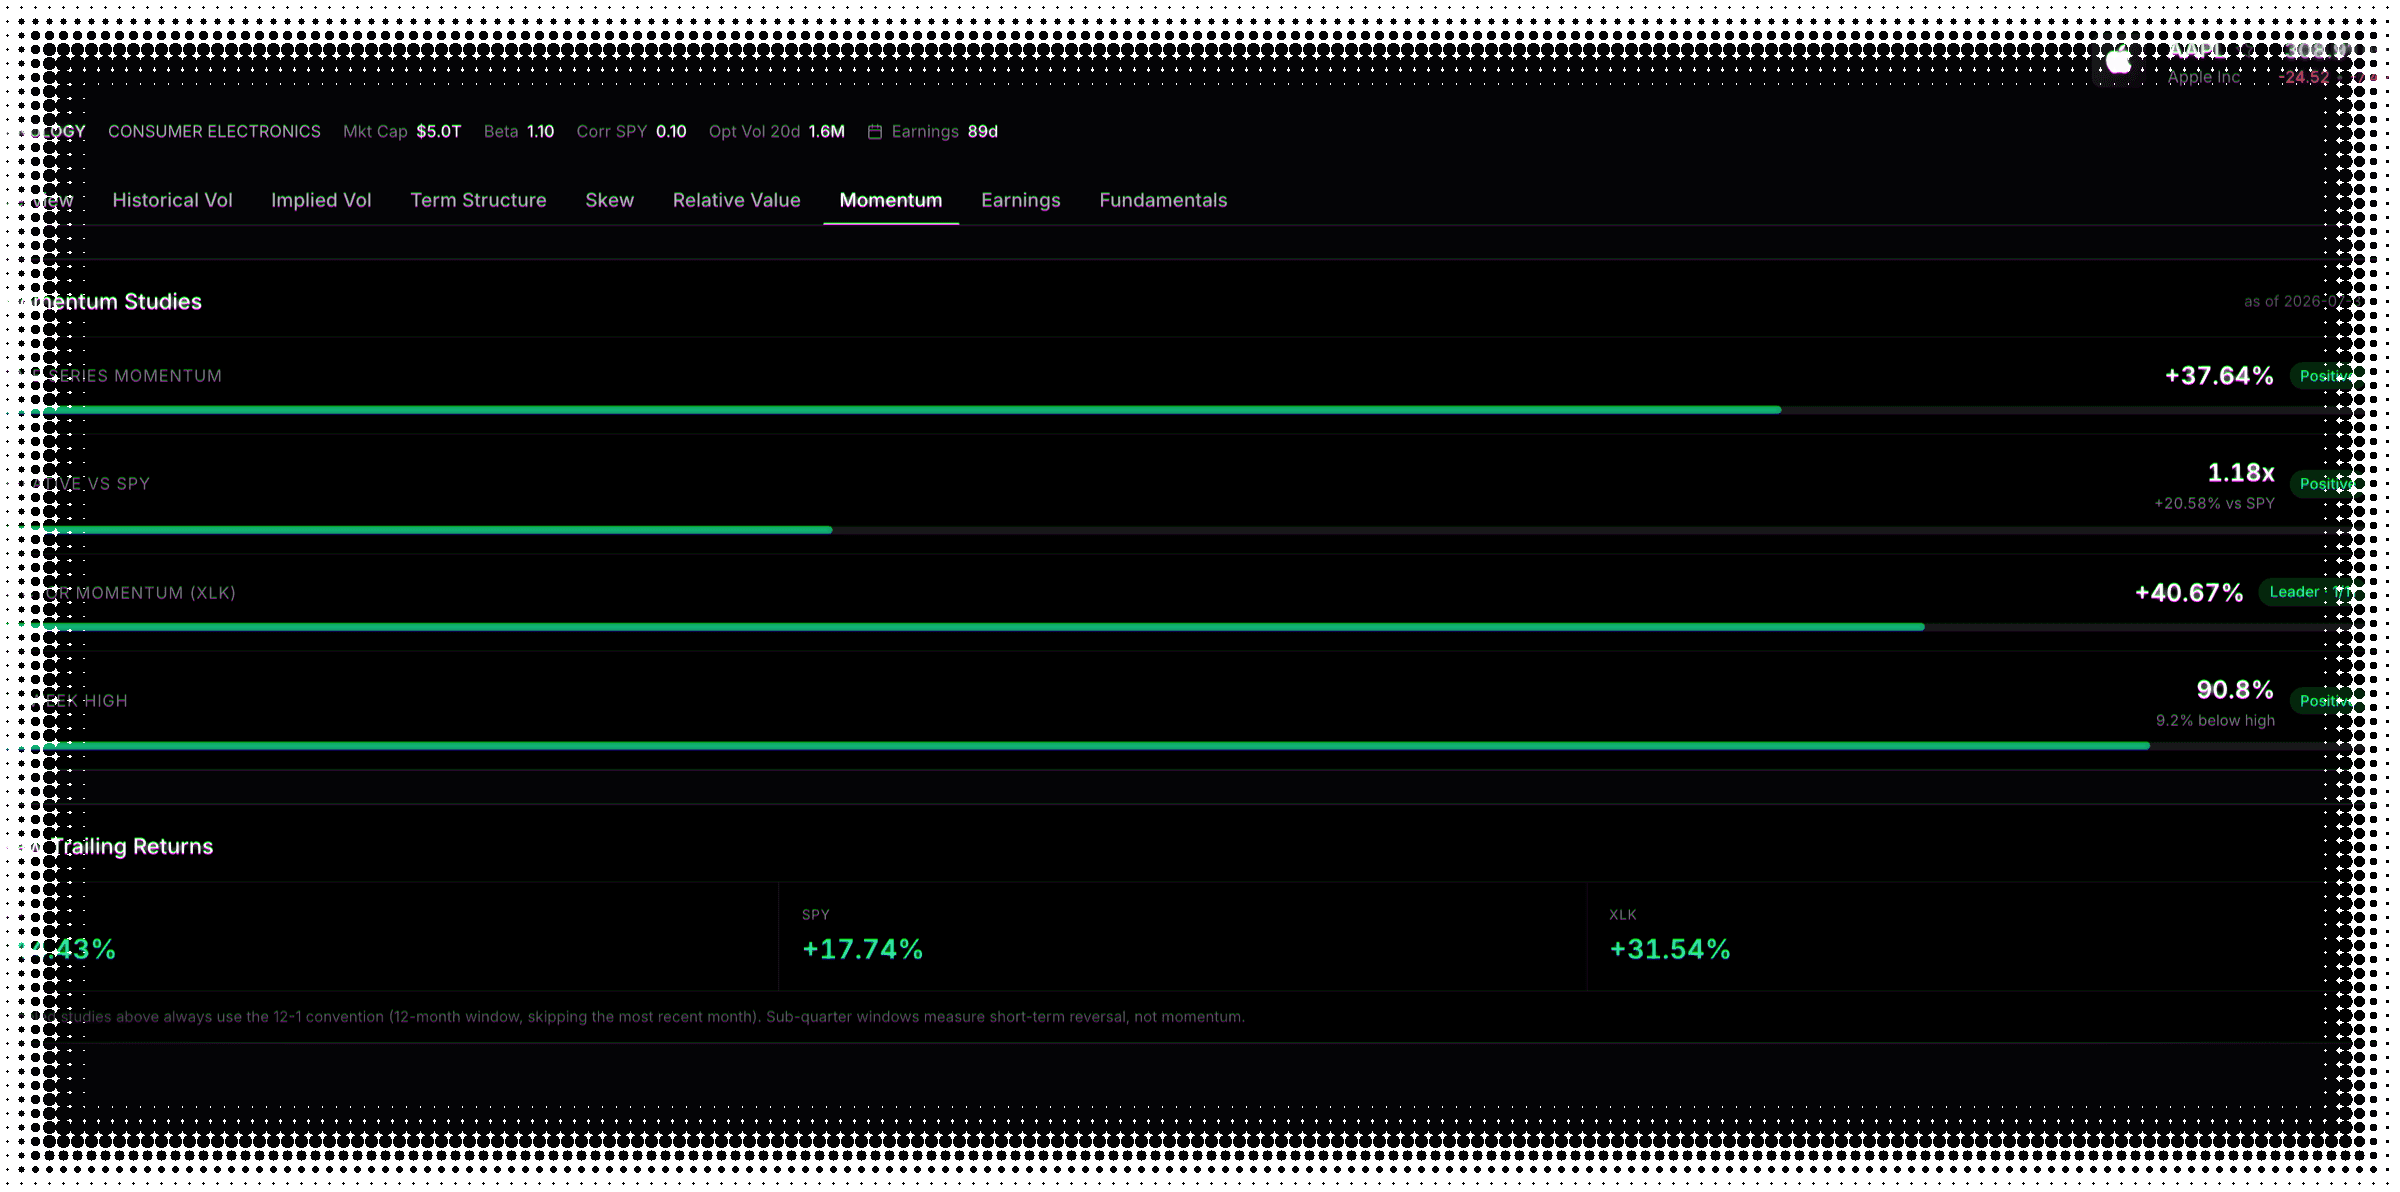
The studies
Four readings, four different baselines
The same twelve months, measured against its own past, the market, its sector, and its own high.
Its own past
Time series momentum
Its return over the twelve-month window, measured against nothing but where it started.
The market
Relative to the market
The same return divided by the index’s, so you can tell a real move from a rising tide.
Its sector
Sector momentum
Its sector fund’s own return, ranked against all eleven — the name, or the neighbourhood.
Its own high
52-week high
How far price sits below its best close of the past year. No return, no window — one distance.
Method
Measured properly, or not at all
The conventions are small, unglamorous, and they decide whether the number means anything.
The three return studies stop a month short of today: over short horizons stocks have tended to reverse rather than continue, so the most recent month is left out.
Plenty of options structures carry directional risk whether or not that was the intent — a vertical spread, or anything leaning on the shape of the volatility smile, has a view on direction built in. This sits alongside those views, measured to the same standard.
Restraint
What it deliberately doesn't do
Momentum is the easiest thing in this platform to oversell. So it isn't sold.
No composite score
Four readings, free to disagree. Blending them into one number would hide exactly the disagreement worth looking at.
No forecast
Every reading describes what a stock has already done — a tendency in the historical record, not a promise.
No invented numbers
Too little history, an unmapped sector, a missing benchmark — the reading goes blank rather than defaulting to zero.
Price momentum FAQ
What to know about measuring a trend
The tendency of stocks that have performed well to keep performing well, and vice versa, over horizons of several months to a year. It is one of the most studied effects in equity markets — documented across decades, countries and asset classes since the early 1990s. It is a statistical regularity measured across large samples, not a rule that governs any individual stock.
Time series momentum measures the stock against its own past. Relative momentum divides that by the index, separating the stock from the market. Sector momentum reads the stock’s sector fund and ranks it against all eleven sectors. And the 52-week-high study measures how far price sits below its highest close of the past year. Four different questions, four separate answers, deliberately never combined.
Three of the four do, and it is worth being exact about which. Time series momentum follows Moskowitz, Ooi and Pedersen (2012). The relative study follows Antonacci (2016) and Jegadeesh and Titman (1993). The 52-week-high study follows George and Hwang (2004). Sector momentum is the exception: it is a rotation and relative-strength read rather than an implementation of one specific paper, and we would rather say so than imply a citation it does not have.
It measures the return from twelve months ago to one month ago, leaving the most recent month out. The gap is deliberate: over very short horizons stocks have tended to reverse rather than continue, so including the latest month muddies the reading. Skipping it is the convention the original research uses, and the three return-based studies all follow it.
No, and this is the one place the studies genuinely differ in construction. It is not a return at all — it is the current close divided by the highest close of the trailing year, so it has no twelve-month window and no skipped month. It answers "how close to the top is this?" rather than "how far has it travelled?", which is why it can read strong on a stock whose twelve-month return is unremarkable.
The sector fund, not the stock. It takes the exchange-traded fund mapped to the stock’s sector, measures that fund’s own return over the same window, and ranks it against all eleven sector funds — reported as leader, middle or laggard with the rank alongside. So it tells you about the neighbourhood the stock trades in, which is a different question from how the stock itself has done. Names whose sector we cannot map, including most ETFs, show no reading here.
Because the four studies measure genuinely different things, and when they disagree that disagreement is the most useful thing on the page. A stock can be up strongly on its own while lagging its sector, or sit near its 52-week high while trailing the market. Averaging those into one number would throw away exactly the part worth knowing.
Alongside the studies there is a plain trailing-return strip — one, three, six and twelve months for the stock, the index and its sector fund, with no skipped month. It is there for context, and the tab labels it honestly: sub-quarter windows measure short-term reversal, not momentum. We would rather show the short numbers and say what they are than leave them out or quietly call them momentum.
No, and the platform doesn’t suggest it does. Every reading describes how a stock has already behaved. The research shows momentum has historically tended to persist, but a tendency measured across thousands of stocks over decades is not a statement about any one name next week. Nothing here is investment advice.
It shows a dash, never a zero. A blank can mean the stock lacks the history the window needs — a full year plus the skipped month — or that its sector has no mapped fund, or that benchmark data is missing for the period; the tab’s explainer lists those causes. A fabricated zero would be worse than a blank, because on these studies zero reads as a real and roughly neutral result.
The large, liquid US names and the major index ETFs — the same universe the rest of the platform analyses. Rather than promise a number that drifts as the universe changes, the tab answers it directly: type a ticker that isn’t covered and it says so plainly instead of rendering an empty chart or guessing at values it doesn’t have.
Because plenty of options structures carry directional risk whether or not that was the intent. A vertical spread, or a position that leans on the shape of the volatility smile, has a view on direction built into it — and momentum is one of the best-documented ways to describe the trend a stock is already in. It sits alongside the volatility views so the directional picture is in the same place, measured to the same standard.
Still have questions? Contact support
Measure the trend, not the story.
We're getting ready to launch. Join the list and you'll be first in the door.