Historical Volatility
Realized volatility, measured properly
A realized-vol number you can defend — before you set it against what the options market is charging.
8 estimators · Ex-earnings views · 4 years of range
Measurement
Measure it every way that matters.
No single estimator is best, and each one sees something the others miss.
Estimators
Seven ways to measure it
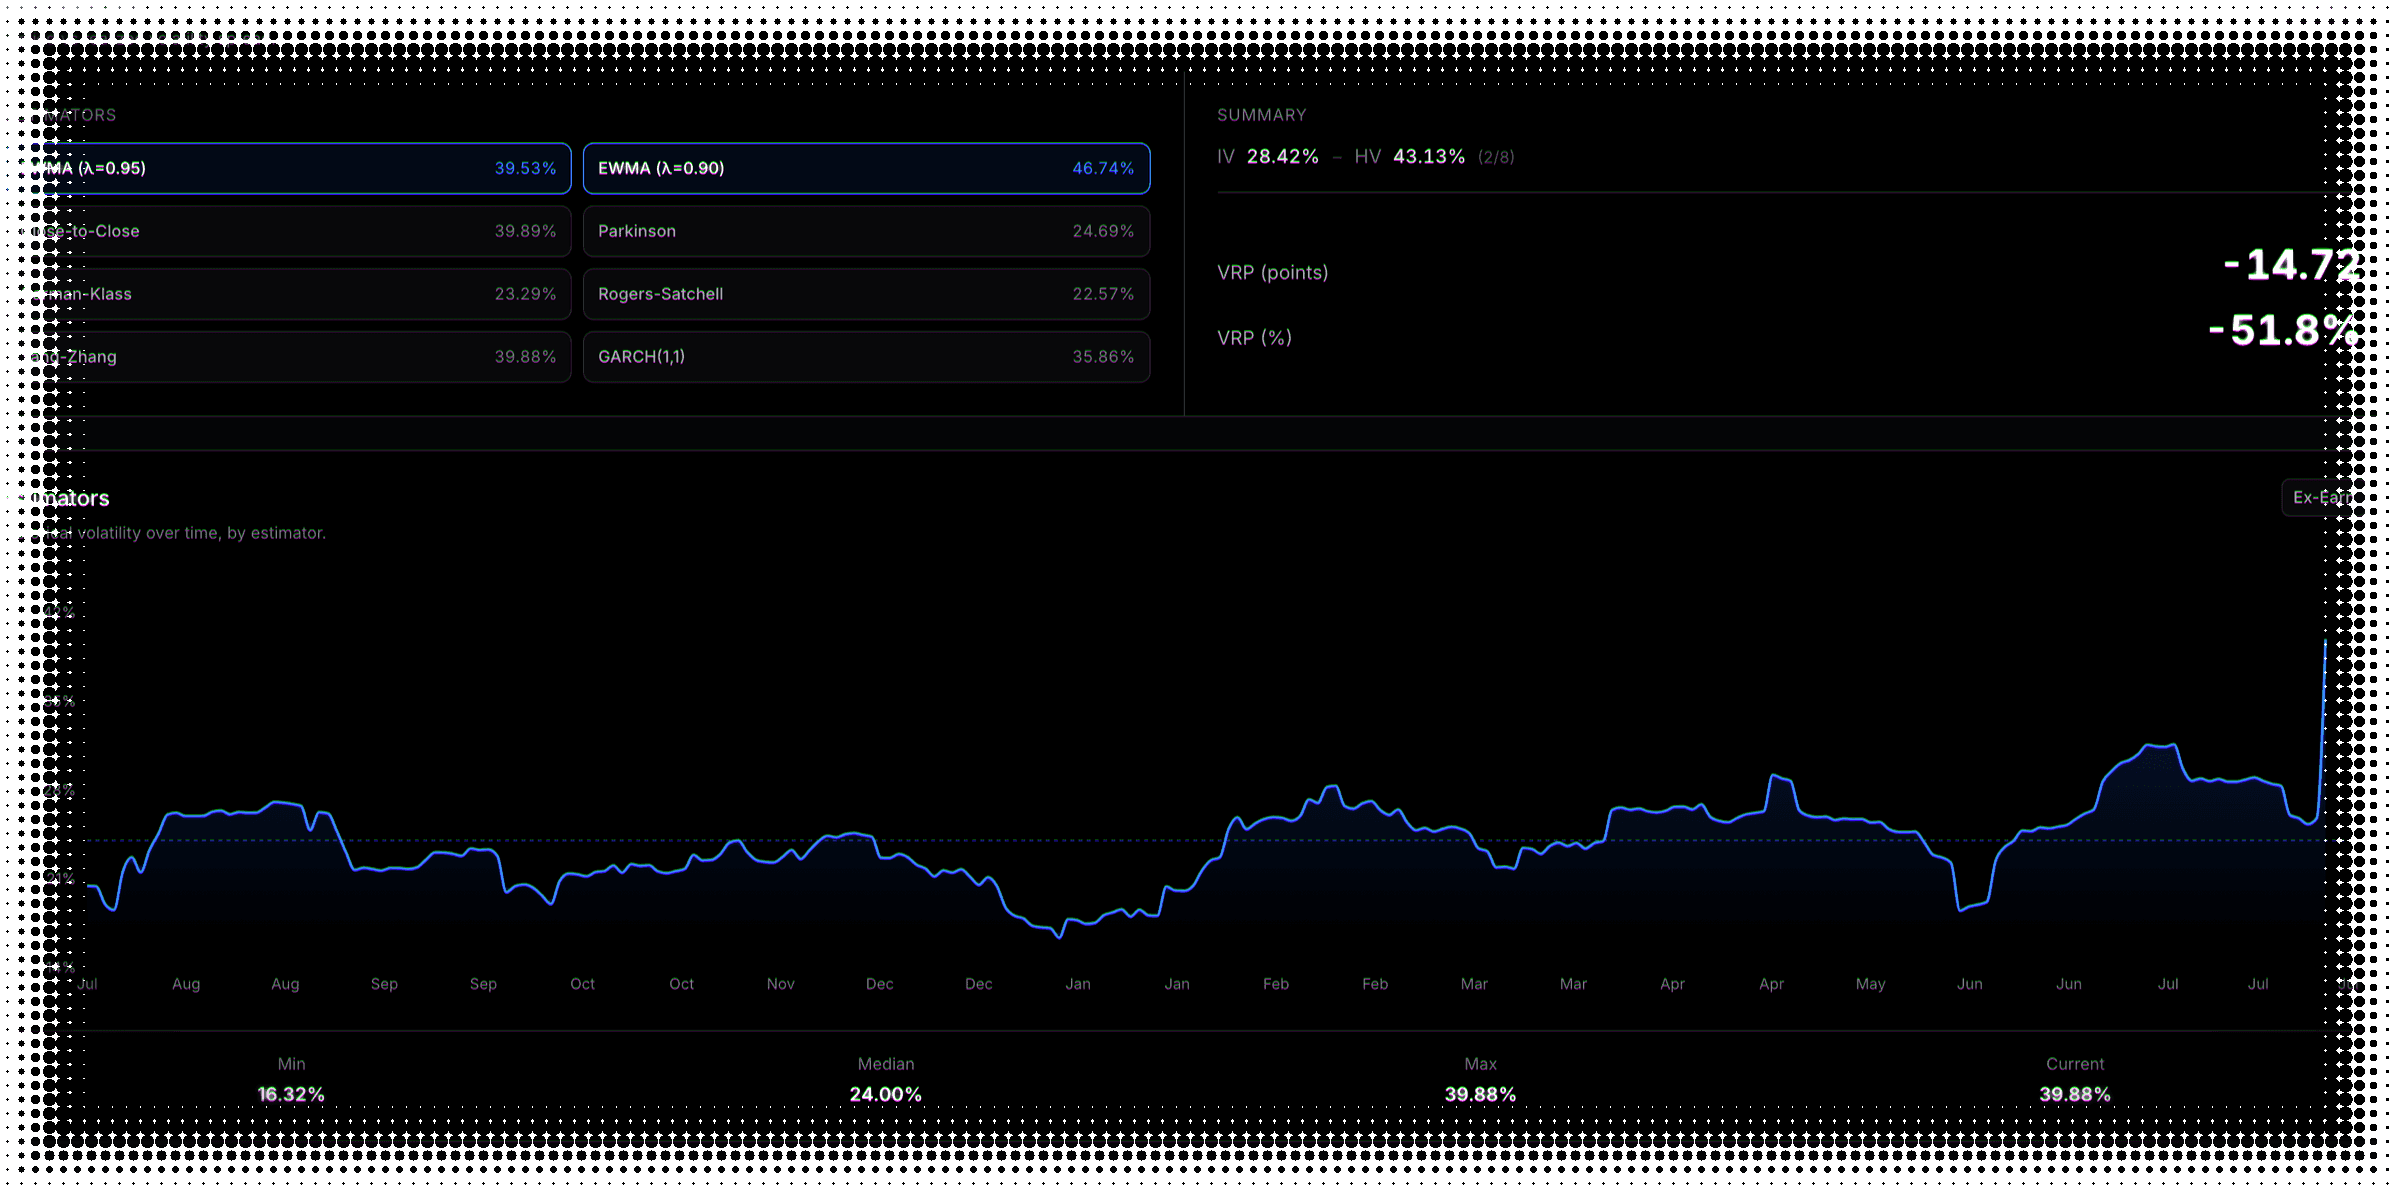
Close-to-close, four range-based estimators, two EWMAs. No single one is best, so you see them together.
Forecast
A GARCH(1,1) that’s actually fitted
Fitted by maximum likelihood on every request, then projected forward. Fitted, not looked up.
Regime
Where today sits
Percentile and rank against the stock’s own year, and whether it’s quieting or expanding.
Ex-earnings
Take the earnings day out.
One day of news isn’t how a stock trades. Remove it and measure what’s left.
Range
High or low — for this stock.
Volatility cones put today’s reading against four years of the stock’s own range.
Wide at one month, narrow at six — short windows scatter, long ones average out.
Comparison
Then set it against implied.
One side measured, the other quoted. The spread is what you get paid to carry.
Your ensemble
You pick, we average
Eight estimators, tick the ones you trust. Defaults to the two EWMAs, averaged evenly.
The spread
Set against 30-day implied
Model-free implied on one side, your realized number on the other, in points and percent.
A comparison, not a prediction — and the other half of it lives in Implied Volatility.
Historical volatility FAQ
What to know about measuring realized volatility
Historical volatility — realized volatility means the same thing — is the volatility a stock actually exhibited, measured from its past price data. Implied volatility is what the options market expects going forward. Premium selling lives on the gap between the two, and realized volatility is the half of that comparison you can measure precisely.
Because no single estimator is best, and each contains information the others miss. Close-to-close only looks at daily closes; Parkinson and Garman-Klass use the intraday range; Rogers-Satchell tolerates drift; Yang-Zhang handles overnight gaps; the two EWMAs weight recent days more heavily; GARCH(1,1) adds a fitted model. Comparing them — or averaging the ones you trust — gives a far more defensible reading than any single number.
It is a fitted model rather than a rolling measurement: maximum-likelihood estimated on roughly four years of the stock’s returns, projecting volatility over the next 21 trading days. The EWMAs are forecasting models too — GARCH differs by mean-reverting toward a long-run level rather than decaying from the last shock. Treat it as one input to your realized-volatility estimate, not a trading signal.
The two EWMAs, averaged with equal weight. That pairing is a deliberately conventional starting point — a simple average of exponentially weighted estimates is a well-established baseline for forecasting realized volatility, and it is hard to beat without a lot more machinery. You can tick any of the eight on or off; the ensemble is always an unweighted mean of whatever you have selected.
Earnings reactions are one-off events that can dominate a volatility calculation without saying anything about how the stock normally trades. The ex-earnings view removes those reaction days before anything is computed, so every card shows the stock’s ambient, day-to-day volatility. The alternative — letting an exponential decay taper the spike away over following days — gets the shape wrong, because there is no smaller announcement tomorrow.
No, stocks only. ETFs do not report earnings, so there is nothing to strip and the toggle simply does not appear for them. The GARCH forecast also keeps its standard fit rather than offering an ex-earnings variant.
A volatility cone shows the historical range of realized volatility — maximum, 75th percentile, 25th percentile, and minimum — across four measurement windows from one month to six months, built from about four years of daily data, with today’s reading plotted on top. Cones are wide at short windows and narrow at long ones, because short-window readings scatter while long ones average out.
By checking your estimate against the range instead of against another single number. Selling one-month implied volatility at 15% looks sensible against a 12% forecast — until you see that one-month realized volatility has ranged from roughly 11% to 35% over the past few years. The forecast has not changed, but the trade looks very different. A point estimate cannot tell you whether the risk is worth the premium; the distribution can.
No. The cone bands are raw percentiles of overlapping rolling-window observations, with no small-sample or overlap correction applied. Overlapping windows share data, which induces correlation between the observations, so the bands are somewhat narrower than an independent-sample treatment would produce. Read them as a descriptive picture of the stock’s own range, not as a statistically corrected confidence interval.
Because the spread is mostly compensation, not free money. Option sellers are effectively selling insurance, and implied volatility sits above realized for the same reason premiums sit above expected claims — and sometimes volatility is bid up for a reason that has not shown up in the price yet. The point of measuring the realized side properly is telling an ordinary premium from a genuinely rich one before you agree to carry the risk.
Roughly five hundred of the most liquid US stocks, plus major ETFs — the same universe the rest of the platform analyses. Everything on this page works for both; the one exception is the ex-earnings view, which is stocks-only because ETFs don’t report earnings. If a symbol isn’t in the universe the page says so rather than showing you a half-populated chart.
No — deliberately. Everything on the page is computed from end-of-day data: realized volatility, the cones, and the GARCH fit are all built from daily history, where a few hours of staleness changes nothing. The edges this page helps you find are structural, not fleeting. If a trade only works with a live feed, it is not the kind of trade this page is for.
Still have questions? Contact support
Get a realized-vol number you can defend.
We're getting ready to launch. Join the list and you'll be first in the door.